
A little over a year ago, I wrote an article entitled Exclusive Vs. Non-Exclusive Finally Answered, which recounted the experiences of my first year selling with some of the largest public-sourced stock sound libraries available on the internet. Before logging a year's worth of sales data, I posed an ultimate question as the basis of my article.
“Do I really benefit from AudioJungle’s high exclusive royalty rate, or will I make more money selling on a non-exclusive agreement with multiple companies?”
Last time, I determined that answer to be quantifiably in favor of the non-exclusive option. I have continued the process of logging my sales information since the last article in an effort to gain insight into the long-term sales of an established sound effects business. This year, with more data from an ever-evolving market, I want to pose a new ultimate question:
“Does selling on a non-exclusive agreement maintain an advantage over selling exclusively, and is it a sustainable source of passive income?”
If you have not read the first article in this series, I recommend starting there, as this article will be full of comparison charts that build on the previous experiments without re-capping the original concepts in great detail.
This year was a good experiment in the longevity of stock sound effects sales as a reliable source of passive income. Shortly after writing the first article in the series, I had a significant career change, which kept me from adding many new sound effects to my portfolio. This, in effect, means that any sales data I’ve recorded in Year 2 is the sustaining result of the previous year’s work. This begins to give us an indication of the general viability and sustainability of selling stock audio.
Changes in AudioJungle
2014 has been a year of significant change for the Envato Marketplace. Beginning in September of 2014, Envato restructured their sales model from a simple commission percentage issued to the author, to a complicated three-pronged profit sharing system including an Envato Buyer Fee and Envato Author Fee subtracted from the original selling price. Beyond their mumbo jumbo explanation of the system which can be found HERE, the important information to glean from it is that the rate for Non-Exclusive Authors has effectively increased from 33% to 36%, while the variable rate for Exclusive Authors has remained unchanged (between 50 and 70%). Based on this change, my conclusion is that there is an increased probability that the Non-Exclusive rate is the more beneficial pay model for authors.
Also starting in 2014, Envato began increasing prices of certain items on AudioJungle. The track selection process and price increase have not been explained in detail:
“These decisions were based on a variety of key factors, including our market dynamics, outcomes of recent pricing tests, the relative pricing of our items, historical pricing changes, and ongoing community feedback.”
–BenChan
You can view the full post HERE
A few of my tracks have been selected for a price increase, and the average increase was between $1 and $2 for sound effects—for example, a $1 short sound effect had its price increased to $2. By increasing prices to be more equivalent to its competitors, AudioJungle is able to offer a higher amount of compensation to its authors. This change increases the probability that selling exclusively may yield higher income, and is a correction to one of my major arguments for selling non-exclusively in the previous article.
RESULTS & ANALYSIS
Total Income/Sales By Company
By viewing the total income broken down by company and by year, we can see a clear increase in the total income between year one and year two [F1].
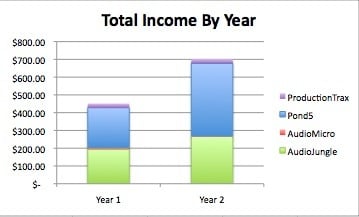
Figure 1: Total Income by Year
This was to be expected since year one essentially began at no income, while year two began where year one left off. We can also calculate the percentage of the total income earned by each company.
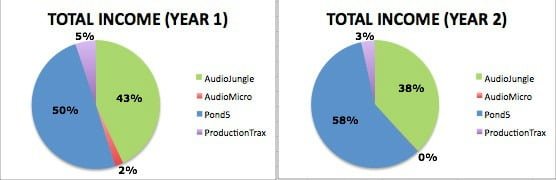
Figure 2: Total Percentages of Income by Company
Figure 2 shows the difference in percentage of total income earned per company, separated by year. AudioJungle and Pond5 remained the heavy hitters in both years, but there is a slight shift in the percentage of dominance. In year one, Pond5 commanded 50% of the pie, with AudioJungle only shortly behind at 43%. However, year two suggests a growing disparity between the two companies, with Pond5 commanding 58% and AudioJungle only 38%.
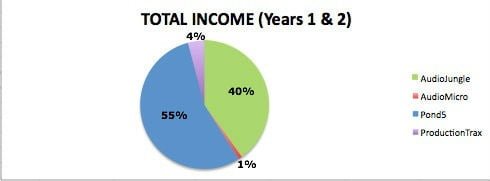
Figure 3: Percentage of Total Income by Company
Figure 3 combines the percentages of both years to show the cumulative percentage of each company over the course of the two-year experiment.
The following line graph [F4] shows the progression of income per company by month over the full two-year span of the experiment. By viewing the income earned over time, we start to see that Pond5 is making a modest pull away from AudioJungle.
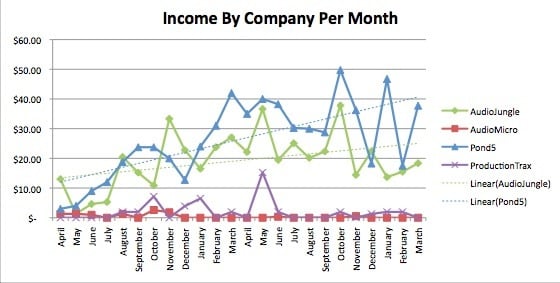
Figure 4: Income by Company per Month
Unlike last year, Pond5 income is now almost consistently higher than AudioJungle, and as a result of a few poor performing months on AJ near the end of the fiscal year, the gap between the two has grown substantially.
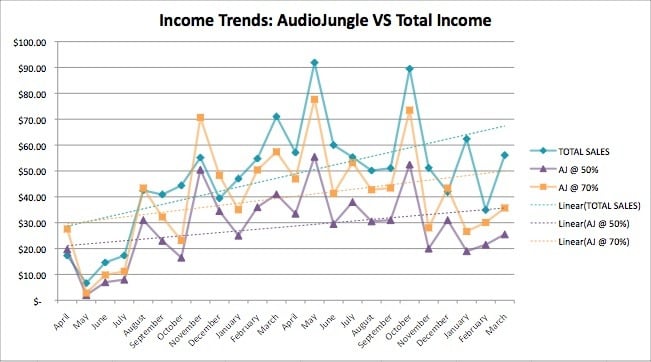
Figure 5: Income Trend Comparison by Company
When comparing the actual earned income trend to the prospective AudioJungle exclusive rate range from 50% to 70% commission [F5], the result is no different. The disparity in the later months of the experiment affirms that income growth as a non-exclusive seller outweighs the benefit of selling exclusively on AudioJungle.
THE QUESTION OF SUSTAINABILITY
Regarding the question of sustainability, we can use trend lines to view either the growth or decline of total income earned over a period of time.
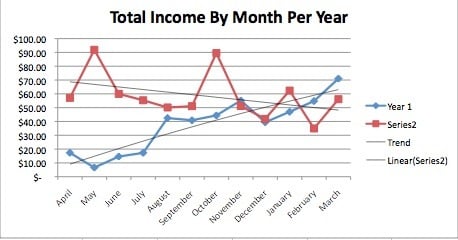
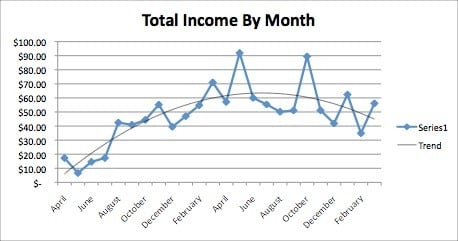
In a comparison of trends between year one and year two total income earned [F6], we can see a clear decline in income growth of my company from year one into year two. In fact, year two even suggests a slow general decline in the average earned income. When we view the income trend over the course of two years [F7], it confirms that my income growth has discontinued and has entered a decline near the end of year two.

Figure 6 - Total Income By Month Per Year (2 years)

2015 Figure 7 - Total Income By Month
How Could This Be?
As I mentioned earlier, after reaching an earned income high at the end of the first year, I have not committed any additional time to building the business. Like any business, it requires attention, product innovation and promotion to maintain growth in an expanding market. Given the steep decline in AudioJungle income in the recent months as indicated in Figure 4, it also suggests to me the quantity of material available on AudioJungle is growing exponentially, and is thus watering down the market for existing authors. For example, Sound Ideas, a well-known commercial stock sound effects library entered the AudioJungle market in 2014. Within a year, Sound Ideas has added over 13,000 sound effects to their portfolio, amassing approximately 17.3% of the total sound effects available on the market. This level of growth is detrimental to individual authors within the market, who, on average, maintain a portfolio of less than 300 items, or 0.04% of the total.
ANSWERING THE ULTIMATE QUESTION
So is it still more profitable to sell non-exclusively to multiple companies at lower rates than it is to sell exclusively to AudioJungle at higher rates? Based on the data and my interpretation of a growing disparity between Pond5 and AudioJungle, my answer again this year is a quantifiable “yes”.
Whether or not it is a sustainable form of passive income is yet to be determined. Looking at the year two data suggests that my average income is currently in decline, but sales still come in regularly even though the business remained largely untouched. Is this not the definition of passive income? Comparing the results of year one to year two regarding sustainability is inaccurate since the initial income growth of a startup company embellishes the trend lines in a steep upward direction. I think comparing year two and year three will provide a more accurate depiction of the long-term health of the company. Until then, keep reading, keep selling, and see you next year.
